Currently viewing the tag: "Presentations"
by Robert Farmer and Paul Rice
It’s no easy thing to create an interesting, engaging and effective educational video. However, when developing educational presentations and videos there are some straightforward principles that you can apply which are likely to make them more effective.
The following videos were created for our course, Creating Effective Educational Videos, and will take you through the dos and dont’s of educational video-making.
1. How not to do it!
This short video offers a humorous take on how not to make great educational videos.
- Prof. Oliver Deer discusses his approach to making educational videos: https://youtu.be/cKXx9GkeGGQ
2. Understanding Mayer’s multimedia principles
This 20 minute video outlines Richard Mayer‘s principles of multimedia learning and provides practical examples of how these principles might be applied in practice to create more effective educational videos.
- A Practical Guide to Mayer’s Multimedia Principles: https://youtu.be/m0GMZgaC7gM
3. Applying Mayer’s mutimedia principles
Because much of Mayer’s work centres around STEM subjects (which typically make a lot of use of diagrams, charts, tables, equations, etc.) We spent some time thinking about how to apply his principles in subjects which are more text based. To this end, we recorded a 12 minute video lecture which is very on-screen text heavy in which we tried to make use of as many of Mayer’s principles as possible.
- Are we ever justified in silencing those with whom we disagree? https://youtu.be/Dyu94dH2aeo
4. Understanding what students want, and don’t want, from an educational video
Given the current popularity of educational videos, and given the time, effort and expense academics and institutions are investing to provide educational videos to students, we thought that it was worthwhile to evaluate whether students actually want and use these resources. You can find the results of our investigation in our paper:
- Rice, P. and Farmer, R. (2016) Educational videos – tell me what you want, what you really, really want. Journal of Learning Development in Higher Education, Issue 10, November 2016. Available from: https://journal.aldinhe.ac.uk/index.php/jldhe/article/view/297
5. Further reading
Mayer, R. (2009) Multimedia Learning, 2nd Edition. Cambridge University Press.
https://www.cambridge.org/gb/academic/subjects/psychology/educational-psychology/multimedia-learning-2nd-edition
Rice, P., Beeson, P. and Blackmore-Wright, J. (2019) Evaluating the Impact of a Quiz Question within an Educational Video. TechTrends, Volume 63, pp.522–532.
https://doi.org/10.1007/s11528-019-00374-6
 Although Staff have access to Panopto to record their presentations, students have had to do things like embedding audio into PowerPoint to create multimedia presentations until now.
SlidesLive can work in a very similar way to Panopto – download the recording software (for Mac and Windows), record the presentation, upload it and make some editing changes. It is slightly different in that it converts each slide to an image, the advantage being that it’s possible to replace or remove a slide using the online editor. It’s also possible to add a second ‘stream’ by using a video clip from YouTube that can be viewed alongside the slide images – the viewer can adjust the relative sizes of those two pictures.
There’s nothing to stop you adding a YouTube video directly in the online editor, then adding a number of images (these could be captions or even a transcript) which you can synchronise to the video. You’re not obliged to just capture PowerPoint, the recording of the slides is just a screen capture, so you can use other presentation software or just capture a screen (just one screen if you have two).
In its simplest form, most students would have very little difficulty in creating a basic presentation. The down side is that although uploaded presentations can be made unlisted, they cannot be downloaded so are unsuitable for summative assessments. However, presentations can be made public, perhaps as part of a portfolio or an online CV. The slide/video combination also opens up the possibility of more creative uses – critiquing someone’s video presentation or interpreting the content. 
You can find a video/slides example here. SlidesLive does require users to register using a simple email – as ever, we’d suggest avoiding the Facebook login option.
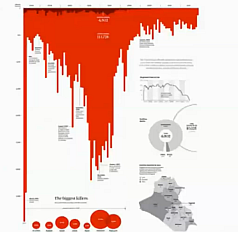 Data Visualisation has become an important aspect of our lives and the ability to present data in interesting ways has always had a role in teaching and learning. On behalf of Tableau Software, Andy Kirk recently presented a fascinating overview of the challenges of Art vs Science in data presentation.
The overall message is that the nature of the visualisation needs to be appropriate for its intent – is this exploring or explaining, thinking or feeling? So, for example, is a filter needed to explore the content or is a bold graphical statement required? 
Andy refers to his excellent web site visualisingdata.com during the presentation – the ‘resources‘ section contains a massive selection of applications that could be used, including a ‘Web’ section where most of the free online tools can be found. We have already experimented with some of these – Tableau Public and Infogram, for example – but there are many promising new ones such as Numberpicture that we hope to review as they become more polished. The ability to link to live data feeds as well as static data opens up a wide range of possibilities.
The video is a little long – around 50 minutes – and the sound is quite poor (it was a webcast after all), but is highly recommended for anyone considering creating infographics or visualisations themselves or asking students to submit assignments in this format.
Click here to launch the video (slides from the presentation – large file! 85mb)

Last December, Economics Lecturer at NBS, Dr Kevin Deane, took the unusual step of abandoning 4 weeks of his timetabled lecture programme and replacing it with a group exercise culminating in an academic poster exhibition (see this blog posting for more details!)
The exhibition was a real success, particularly for a first-time event, as evidenced by the comments from the students and other NBS staff who attended the exhibition. That said, Kevin has some definite changes and improvements he would introduce next time around. But, in these days of NSS scores and working to improve the student experience, the big question to be answered is … what did the students think?
Generally, their reflections mirrored those of Kevin himself. Apart from an appreciation of the refreshments (!) the following comments are worth mentioning in response to the question of what was good about the task:
- One student responded by saying that the good thing was the “big range of information exchanged and displayed, very insightful. Food was good, getting tutors and guests involved.”
- Another enjoyed the fact that they didn’t have the pressure of an assessed assignment.
- “People did them relatively well. Rewards were good incentive”.
- Another student commented that it “was a great insight into a variety of economists. It provided me with a better understanding of these economists and their philosophies.”
There were some technical hitches on the day of the exhibition itself. In particular, Kevin had been expecting the room to be ready when he and his students arrived, but an error in communication meant that an hour was lost having to set up the exhibition boards. This did have a significant knock-on effect for students as the first hour of the session was lost. This had been scheduled for a student-student presentation of each of the posters, which would have provided the primary opportunity for students to learn about those other economists being studied by their peers.
The following student comments on what could be done differently/better mirror Kevin’s own reflections. Specifically, the students were keen that copies of the other posters were circulated – something Kevin had already planned to do. This is of particular importance pedagogically – where students are creating and generating module content which forms one jigsaw piece of the whole picture, ensuring that each student has access to the full and final picture is essential. Another comment was that it was rightly considered unfair that some students were asked to produce posters on economists that had already been studied in class whereas others were starting from scratch. Looking ahead, Kevin would ensure this didn’t happen again and recognises that it was purely circumstantial, arising from the decision to move away from lecturing to the poster exhibition after the lectures had begun. In itself, this was engendered by student feedback indicating that the lecture approach to this topic was dry and uninteresting.
One final comment worth addressing directly was that students considered the poster to be “too much extra, [it was] not part of our course.” This feedback reflected a failure to appreciate that this poster wasn’t actually ‘extra’ work per se, rather a change in the way the module content was being taught. In future, Kevin would draw attention to the fact that the requirements of producing a poster are no more onerous in terms of the expected study time than indicated in the module spec: 4 students per group x 3 hours per week of independent study x 3 weeks = 36 student study hours per poster.
Other negative comments included the following:
- It was a lot of work, for no obvious reward in terms of assessment.
- Lack of assessment meant no incentive to produce high quality.
- Doing a poster on one subject was limiting.
- Some people didn’t even go.
Having allowed time for both his personal and the students reflections, the following changes would, Kevin believes, improve the exercise next time around:
- Ensuring that the dedicated time for student-student presentations is preserved to ensure that all students receive the benefit of the work done by other groups and learn about all the economists studied in the module
- Explicitly recognise the focus that students place on assessment and grades and therefore turn the task into the first assessment for the module and run it earlier in the academic year when students were not under pressure to complete assessment tasks for other modules
- Ensure that the key points are captured in a summary ‘timeline’ lecture that places them all in context.
Probably the biggest objection he has to overcome is the idea that this task placed an additional burden on students and this really boils down to managing their expectations more explicitly. A clearer explanation and on-going reminder that the poster itself should be the final product of 36 student study hours (9 per student) would go a long way to removing this objection and engendering in students the realisation that this level of work and time investment is, ultimately, what they are at University for!

What do you do when you have a very dry topic to teach and the snores from the lecture theatre are drowning out your words?
Kevin Deane, a new Lecturer in International Development in NBS, faced exactly that problem, some 5-6 weeks into the term. Feedback from the students was clear – “we are bored by this and we are not engaging”. It was time for a radical rethink.
Kevin and I spent about two hours batting ideas back and forth over how to help his class see how the opinions of these long dead men could be relevant to them as 21st century students of economics. I had made a choice not to lecture a group of postgraduate students during a three hour session but instead to spend that face-to-face time on the application rather than the acquisition of knowledge. Could a similar approach be utilised in this context?
The answer came in the form of an academic poster exhibition with each group producing a poster on a different economist which they had to present at an exhibition at the end of term to fellow students and staff within NBS. They also had to explore the relevance of each economist – did they agree with their theories; were their opinions wrong? This had the effect of ensuring a higher level of participation than might otherwise have been the case, given that the poster was not being assessed.
The subsequent 4 weeks of lectures were therefore abandoned and the time allocated to group work on the posters. In spite of some initial discontent Kevin made it clear to the students that this was simply a different approach to teaching and that the students would still be expected to attend and participate. Success was also encouraged by ensuring that students had weekly interim goals and deadlines to work to.
At the exhibition, it was evident that the students I spoke to had engaged with the material and enjoyed finding out about their allocated economist. They had also grasped the concept of what an academic poster was about! A number of staff from NBS were present to ask questions and to help Kevin judge the best poster(s) – three prizes were awarded in the end.
On reflection, Kevin will definitely repeat this approach for this module, but will add an element of assessment to further increase participation and engagement. To read more about the what’s, why’s and wherefore’s, please read his case study – Kevin Deane – Histor.
For now though, this process of resuscitating the wrong opinions of dead men shows that the theories really do live on.
Sally Laurie – Senior lecturer in Marketing and Entrepreneurship has been using innovative technology within NILE for a few years now. Over the last academic year Sally has started to use the Rubrics tool within NILE to evaluate her students’ work using existing marking criteria based on the UMF guidelines and learning outcomes for each module.
With support from Learning Technology, Sally has successfully used rubrics within a classroom, while students present, to mark and feedback on their work. Moderation also took place at the same time.
The case study describes all the details, benefits, challenges and key points: Using NILE (Blackboard) Rubrics to mark Presentations
Using mobile devices can give you a lot more freedom in how and where you work. There is a huge range of apps available to help you deliver a presentation (or lecture), as this is a common task in the business world as well as in education. The apps cover everything from preparation to delivery, the downside being that as these are often aimed at the business market, they can be expensive. Here are some of the ones we’ve come across that you might find useful.
Creating/editing your presentation
 The slickest choice for this must surely be Keynote, for iOS (Apple) devices. You can import existing presentations into the app, via email or cloud storage services like Dropbox – it will accept presentations created in Keynote (on the Mac) or Powerpoint (on a PC). You can also create a presentation from scratch, including images, tables, charts and animations. It even has an area for presenter notes. If you have an iPad 2, when connected to a video output the presenter display will allow you to see both slide and notes, and your audience will only see the slides.
For Android, Google docs seems sadly lacking in the absence of a presenter view for Google presentations. However, there are other options – QuickOffice or Documents To Go will both allow you to display Powerpoint files on your device for free. Both these apps have Pro (paid) options that will also let you create and edit presentations on the device.
Delivering your presentation
If you want to use your device to deliver the presentation, there are a few different options to consider. You can connect the device directly, using a VGA or HDMI adaptor. This is the easiest option, but it does restrict your movement (which can defeat the point of using the device in the first place). Alternatively, you can connect your device to the presenting computer using wireless or bluetooth:
- You may want to use your device as a simple presenting tool, to control navigation through the slides. In this case, apps like i-Clickr for iOS and Presenter for Android should do the trick.
- If you have the presentation on your device, there are also apps that will allow you to transmit it to the presenting computer. AirSketch for the iPad will allow you to project a whiteboard, images or PDFs (so convert your presentation first), and Scatterslides for Android works in a similar way for Powerpoint slides (note this requires a free client to be installed on the presenting computer).
- If you want to get really clever, you can even use a remote desktop application to run the presentation from your own computer via your mobile device, thus avoiding any embarrassing software version problems or incompatibilities. Apps like Splashtop and TeamViewer can do this for you, as long as you have a reliable connection.
The downside to the wireless connection method is that these apps generally need to be on the same wireless connection as the presenting computer – and to be able to find each other on it. This works fine on wireless that uses keys to authenticate, but often won’t work on secure wireless networks that use a browser login. If you’re planning on trying any of these, we strongly recommend a test run before the day of the presentation.
If you have any comments on the information above, or you’d like to recommend other apps that help you with learning or teaching, please feel free to add a comment or to email the team at LTSupport@northampton.ac.uk.
Disclaimer: these posts aim to recommend functionality, not particular products or services. The app world changes fast, and any third party app may not be available forever. Always make sure you have a back-up option.
Tablets seem to be the new ‘must have’ device, and a few staff have been asking us for our thoughts on these. While we wouldn’t necessarily recommend a particular device, we do have a couple you can try out, and the thoughts below might be of some help.
What are they good at?
Tablets are great for carrying around. They’re small, and lightweight, and as a general rule, start-up time and battery life are both much better than a laptop. They are great for on-the-go tasks, like checking email and browsing the web. The point to remember though, is that they usually use a mobile (cut-down) version of the operating system, similar to that used in smartphones, which means that they can’t run the same type of software as a laptop or desktop computer. The software usually comes in the form of ‘apps’, which have different functionality to their desktop counterparts.
What are they bad at?
This varies between models. They usually have a mobile (cut-down) web browser installed by default, which can struggle with web pages that are not designed for mobile use. Famously, the iPad won’t play any Flash content in the default web browser (Safari), so watching video content on the web can be tricky unless there is “an app for that” (for example, there are native apps for Youtube and BBC iPlayer). It can also be tricky to transfer files between your desktop computer and your tablet, unless (for the iPad) you are an expert iTunes user, or (for Android) you use other ‘cloud’ applications to store your work online (such as Google docs).
A quick note about browsers: if you have a tablet, you don’t have to use the default browser that is already installed. Other browsers are available to download, although they may not be free.
Common tasks for University staff
We put some of our tablets through their paces to see if they could support some of the common tasks staff carry out using technology. The findings are below. If there are some more key tasks that you would like us to try out for you, please add your suggestions as comments on this post.
| Task | iPad (Apple) | Motorola Xoom (Android) |
| Syncing work email (Exchange) | Works fine, including calendars and contacts. New appointments can be added but can’t be set to private. | Email, calendars and contacts all work fine. |
| Editing documents | Has a basic Notes app already installed, that allows you to type text and email it to yourself. The iWork suite of apps allows you to work with Word, Powerpoint/Keynote and Excel, and document transfer is done via iTunes or cloud storage services. Google docs can be accessed via the app or the browser, although editing is fiddly. |
Doesn’t come with a basic note-taking app, although Freenote is a good one you can download, that also saves handwritten notes. Documents, spreadsheets etc. can be imported/exported via Google docs, although disappointingly the editing functionality in the browser/app is not much better than in the Apple app. |
| Using NILE* (Blackboard 9.1) | NILE can be accessed through the browser, but editing and adding new items is fiddly as it can only be done with the Visual Editor switched off. | Box pages display slightly strangely in the browser. You can add and edit items, and type using the Visual Editor, but it struggles applying settings from pop-up menus (e.g. text colours). |
| Using Turnitin and GradeMark | Originality reports can be viewed, but navigation doesn’t always work properly. Commenting in GradeMark does not work. | As with the iPad. |
| Presenting | The iPad 2 supports video output, so as long as you have the right connector, you can plug it in to the VGA lead on a lectern (as you would with a laptop), or the HDMI lead for your HD TV, and demo whatever you like. The iPad 1 only supports video output from certain apps, like Keynote. |
Motorola haven’t as yet produced a VGA connector for the Xoom, although it does have HDMI output via the mini-HDMI socket. Apparently it is possible to adapt this to VGA output – see this forum on the Motorola site for more. |
| Adding blog posts (WordPress) | Works in the browser, but better in the (free) app, even though it does display the HTML version rather than WYSIWYG. | Slow and clumsy in the browser – again better in the app. |
| Reading e-books & journals** | Online journals: the Metalib search pages work fine, although the fact that it opens everything in a new window can mean you run out of browser windows quickly (you can only have 9 open at a time). Other useful apps include EBSCOhost, iBase (searches open access repositories, arXiv (e-prints for science subjects) and iScholarReader (Google Scholar app). Library eBooks: Dawsonera – read online works fine, but it doesn’t seem to want to download for reading later. Safari Tech books online works fine, although watch it for it locking you out as the browser has trouble with session IDs. Netlibrary books also work for online reading, although these will soon be moving to EBSCOhost. Other eBooks/files: The iBooks app (already installed) allows you to download from the iTunes bookstore, and EPUB/PDF files can be transferred via iTunes. There is also a free Kindle app available. |
Online journals: Metalib works fine, and opens new tabs, which is more manageable than the iPad browser. There are also Android apps for arXiv and gScholarReader (Google Scholar). Library eBooks: Dawsonera books do not display in the browser (blank pages), and the download option doesn’t seem to work either. Safari Tech books load ok, but scrolling is tricky. The Netlibrary reader also displays as a blank page. Other eBooks/files: The Xoom can read EPUB & PDF files, using an eBook reader app such as Aldiko (files can be transferred via USB). There is also a Kindle app available. |
| Watching video | Major video streaming sites Youtube and Vimeo will play in the browser, however Flash-based video (on sites like the BBC and the University’s Video Library Server) will not. A number of apps are available for streaming, including BBC iPlayer. Video files can be transferred and played using the VLC app. |
Plays Flash-based video, so BBC video and the University VLS work fine, as do Youtube and Vimeo. Video files can be transferred directly via USB. As yet there isn’t an official VLC app, but QQPlayer seems to handle most file types ok. |
| Taking Photos/Video*** | The iPad 2 comes with a camera that takes VGA quality stills (0.69MP). There are two options for video, with VGA quality on the front camera, or HD (720p) on the back. There is an iMovie app but it’s only for the iPad 2, and costs £2.99. |
The Xoom has a 5MP still camera, which will take better photos than the iPad, although they don’t always look as clear on the screen. Also shoots 720p video, and comes with an editing app (Film Studio). |
*more information on accessing NILE on mobile devices will be coming soon, watch this space for more details…
**we also have a Kindle available for loan – if all you want to do is read, then this might be more suitable for you (and cheaper). You may also be interested in the Web Tools for Researchers guide.
***If the camera is your thing, have a look at this comparison by PC World, or this one from TechCrunch.
This case study looks at the use of handheld video cameras (Flip cameras), to allow students to record oral presentations for assessment.
This project was run as part of a third year Environmental Science module, by Dr Janet Jackson in the school of Science and Technology.
Using Flip cameras for oral presentations (case study, PDF 453KB)
Video clip of feedback from students
Mike Twigger, a Senior Lecturer in Mental Health Studies, explores the use of Powerpoint to deliver health promotion materials.
