At the University of Northampton, we provide a range of means for students to engage with their academic programme. We know how valuable this material can be – from teaching and Virtual Learning Environment (known locally as NILE) sites to making library resources available, it is a key part of providing great educational opportunities. Sean Brawley (Student Engagement Manager) in Learntech has looked at a range of student data points to review the possible impact on outcome measures.
[Please note that further work is being undertaken to develop a more robust evaluation process]
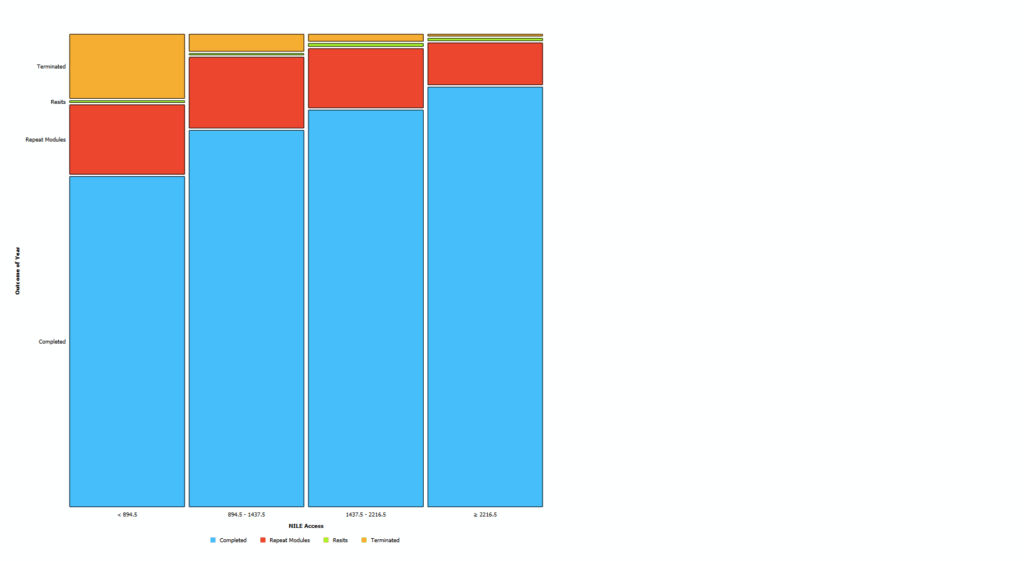
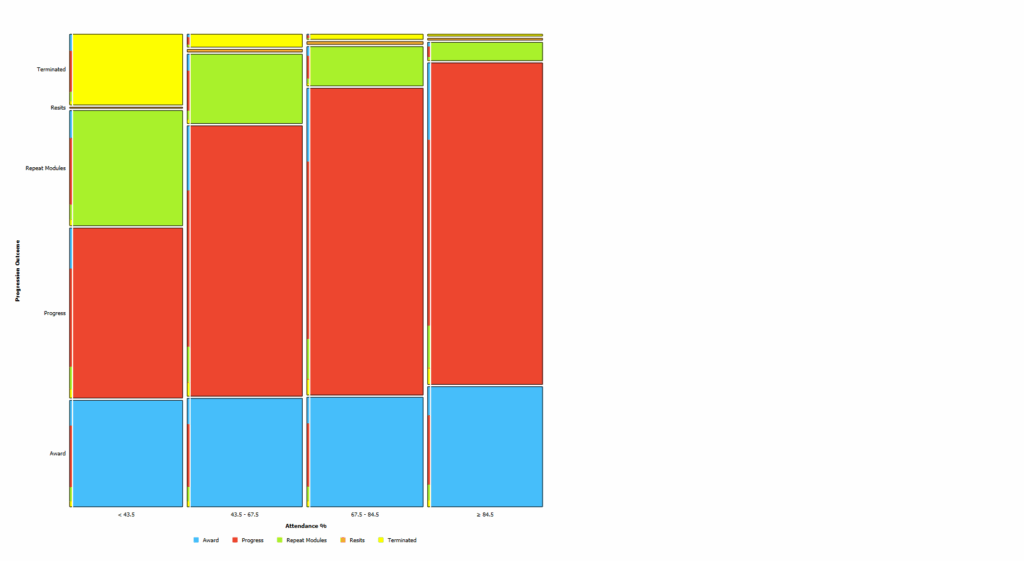
The above two diagrams indicate that students with higher attendance and higher usage of VLE / NILE resources in 2023/24 were more likely to complete the year and less likely to face either termination or module failure.
Where students take advantage of the teaching and electronic resources provided in their course it is likely that they are more likely to succeed in progressing to the next stage.
Its not just a question of progression though- the three charts below** show how students average classification positively correlates with attendance levels, VLE / NILE logins and E-Resource (Open Athens) usage. Staying engaged with the University would seem to be a real driver of students understanding and achievement.
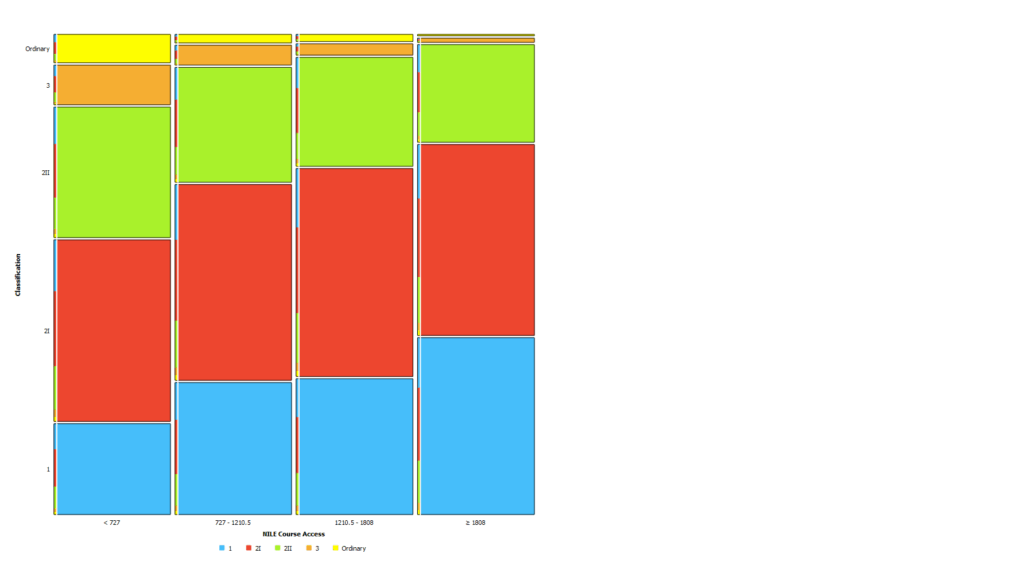
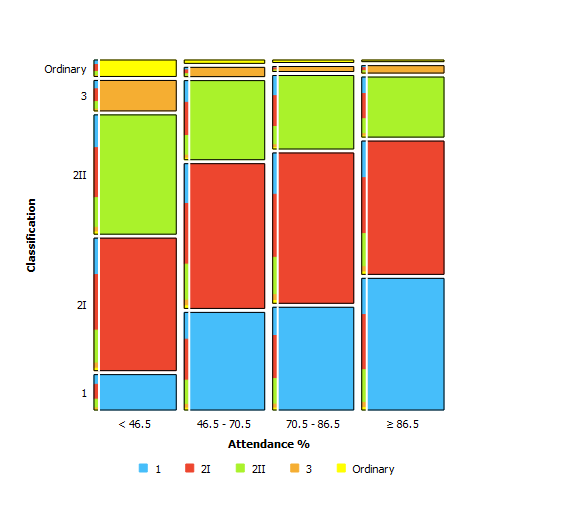
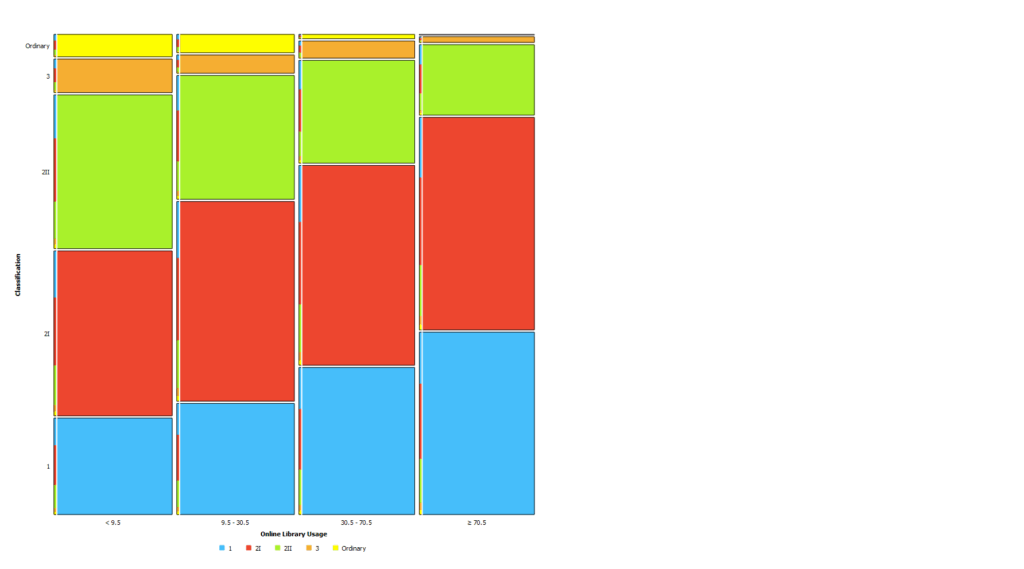
These charts help tell a story- one where students who engage with our teaching and learning materials are likely to be better prepared to succeed in their studies. That’s part of why starting in 2025 the University of Northampton will have a new Engagement Policy- and by supporting and encouraging students to stay engaged with their programme, we are helping them to succeed in their education too.
Of course, student achievement is a complex and multivariate outcome. Each student is an individual, and we can also see from the above data that some students succeed with lower measurable engagement levels, and vice versa- and it’s also the case that there are lots of ways to engage we can’t easily measure!
However, we do know from research across the sector that engagement with teaching, course materials and other key factors strongly correlates with and is a strong input into good outcomes for students. Not only does the current findings indicate the value of increasing these, but it also further demonstrates the possible direct value to students of the work of staff across the institution.
*Based on 7253 23/24 student outcomes
**Based on 1609 23/24 student classifications
At the University of Northampton, we aim to provide our academic staff and students with the best tools for teaching and learning. One such tool is Kaltura, our video and audio media platform which enables tutors and professional services staff to create engaging content as well as allowing students to create and submit video for assessment. But did you know that Kaltura now provides you with detailed insights into your content’s performance? Enter Kaltura My Content Analytics – a feature designed to help you understand how your videos are engaging your students.

What Can You Track?
Kaltura’s My Content Analytics provides you with a wealth of data at your fingertips. For example, you can track:
- Views and Engagement: See how many times your content has been viewed and by whom. This can give you a snapshot of how many students are engaging with the materials.
- Viewer Drop-off: Understand where viewers stop watching, helping you fine-tune your video length or key points.
Focus on Key Data Points
There’s a lot of information available in Kaltura’s analytics dashboard, which can feel overwhelming at first. If you’re a beginner, we’d recommend you focus on Top Videos – this section will show you which of your videos are getting the most views and how they’re performing. Once you’re comfortable with that, you can dive into deeper analytics.
Why Is This Important for Educators?
For educators at the University of Northampton, this data can be very useful. If you’re using video to deliver taught content or supplementary materials, knowing how students interact with that content can inform future teaching strategies. Are students dropping off before key explanations? Do certain areas require more emphasis? This feedback loop can directly impact student outcomes. Combine this insight with the new student engagement analytics in NILE and you have a lot of helpful data to better support your students.
How to Access My Content Analytics
- Go to mymedia.northampton.ac.uk.
- Log in with your university credentials.
- Select My Analytics from the drop-down menu.
From there, you can explore a range of metrics to optimise your teaching content. And if you want to learn more, schedule some training with your Learning Technologist, who can guide you through more advanced features.
If you are interested in how engaged your students are with your video content, then Video Analytics can provide you with some useful insight.
You could discover that your video is a total sensation. That your students watch it over and over again. That they stop at specific points to really take in and digest what you’re talking about. That they are watching it and it is helping them achieve better outcomes.
Conversely, lots of my videos have appeared in front of staff, a small percentage of them click on the video and those that click on the video rarely make it all the way to the end. This forces me to reflect: does it need to be an hour long? Would it be more engaging if it were just 15 minutes? Do I sound very bored?
The wonders of modern Video Analytics have revealed to me that I am not, perhaps, as interesting as I have led myself to believe.
Setting aside my own self-esteem issues, Video Analytics can make a massive positive difference to how you teach and enable you to focus your energy and time in the most productive way.
Every one of your videos in MediaSpace has an Analytics report for you. It can tell you things like how many times a video has been viewed, where your viewers are in the world and what device they have viewed your video on. This is really useful data.
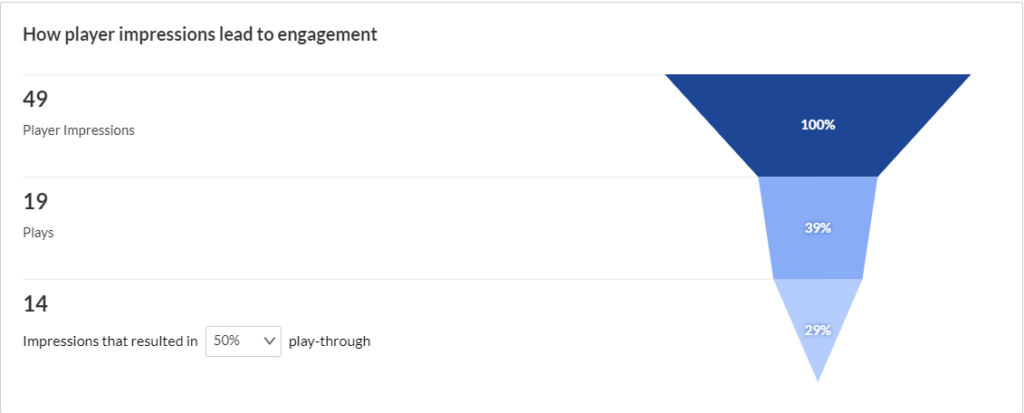
But, let me be clear: you are not required or compelled to use this data. You can continue to produce videos in the same way that you have always done. However, if you are curious to find out how engaged your students are with your videos then feel free to dip your mouse into the glorious world of Video Analytics.
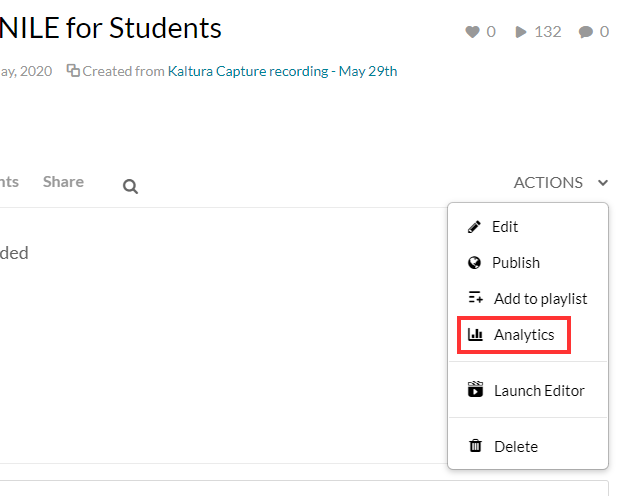
I’m happy to provide a link to some thorough guidance provided by Kaltura or you can contact your subject Learning Technologist and ask them questions about Kaltura analytics or any of our tools and platforms.
This is a link to a detailed guide on Analytics.
One final thought: if you are not inclined to explore Video Analytics then let me offer you one tip: keep your videos short, focused and accessible.
Happy content creation.
Recent Posts
- Blackboard Upgrade – January 2026
- Spotlight on Excellence: Bringing AI Conversations into Management Learning
- Blackboard Upgrade – December 2025
- Preparing for your Physiotherapy Apprenticeship Programme (PREP-PAP) by Fiona Barrett and Anna Smith
- Blackboard Upgrade – November 2025
- Fix Your Content Day 2025
- Blackboard Upgrade – October 2025
- Blackboard Upgrade – September 2025
- The potential student benefits of staying engaged with learning and teaching material
- LearnTech Symposium 2025
Tags
ABL Practitioner Stories Academic Skills Accessibility Active Blended Learning (ABL) ADE AI Artificial Intelligence Assessment Design Assessment Tools Blackboard Blackboard Learn Blackboard Upgrade Blended Learning Blogs CAIeRO Collaborate Collaboration Distance Learning Feedback FHES Flipped Learning iNorthampton iPad Kaltura Learner Experience MALT Mobile Newsletter NILE NILE Ultra Outside the box Panopto Presentations Quality Reflection SHED Submitting and Grading Electronically (SaGE) Turnitin Ultra Ultra Upgrade Update Updates Video Waterside XerteArchives
Site Admin

